“Visualize” is the view where you will customise your Visualization and edit it to suit your requirements.
Highlighted are key features you will want to use. Please see the descriptions below the image for more information on each item.
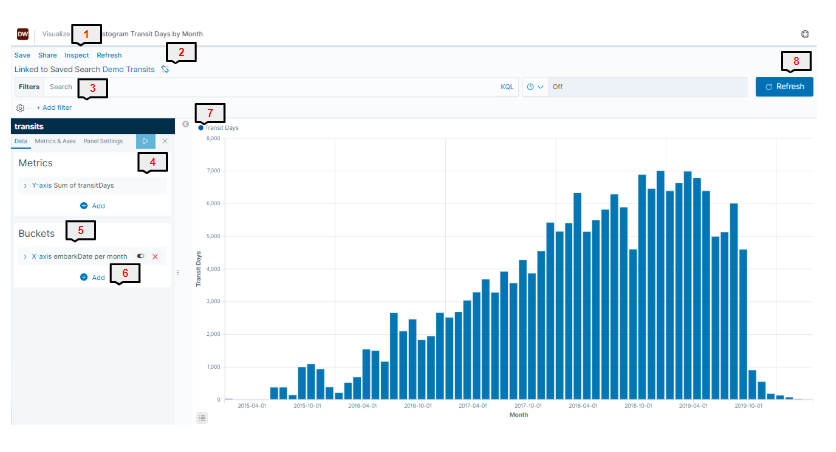
In this example, we have a used a straightforward vertical bar chart, other visualizations are available!
1) Save/Open/Share/Inspect
Save - Save your visualization to be added to a dashboard or for later editing.
Please note when saving, if you wish to save a new copy of the visualization after editing and retain the previous version, you must select "Save as New Visualization" or the existing item will be overwritten.
Share - Share a link to your visualization
Inspect - See data requests made against the selected data, see the raw data captured in the visualization and download a CSV of the raw data.
2) Link
See what data set your visualization is linked to.
3) Add Filter
Add filters to change the data shown in the visualization. See our "Filters" article for further information on filters.
4) Metrics
This sets the metric by which the system will compile. Typical use is "count" which is total number but you can select from various averages and totals in the drop down.
5) Buckets
You can now split the data into "buckets" using a variety of aggregations such as date, terms or a range depending on visualization type and what you want to see. Please see our "Aggregations" article for more information on what each aggregation does.
6) Add
Once you have added your first bucket, you can add further buckets by different aggregations. You can choose to "split" the buckets and you can also split the table or visualisation into multiple charts or tables using another aggregation.
7) Edit Key
This allows you edit the visualization colour schemes and further narrow the data set down using zoom in/zoom out tools.
8) Refresh
Refresh the data in the visualization to ensure you are capturing any changes you may have made to your filtered date set.