Visualize is where you can create new visualizations from your data to add to your dashboards.
To create a new visualization, select "Visualize" from your side menu bar.
You will see the following screen:
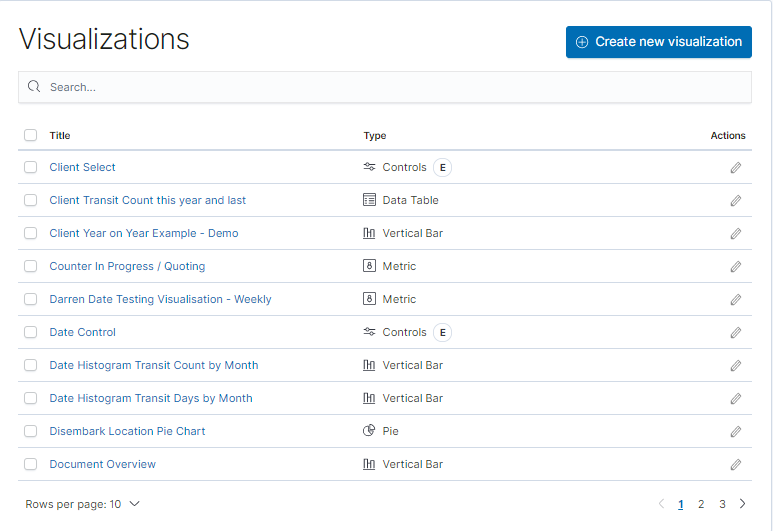
You can select "Create New Visualization" to start a new visualization or edit and manage an existing one by selecting it from the available list.
New Visualization
If you select "Create New..", you will then see the following screen:
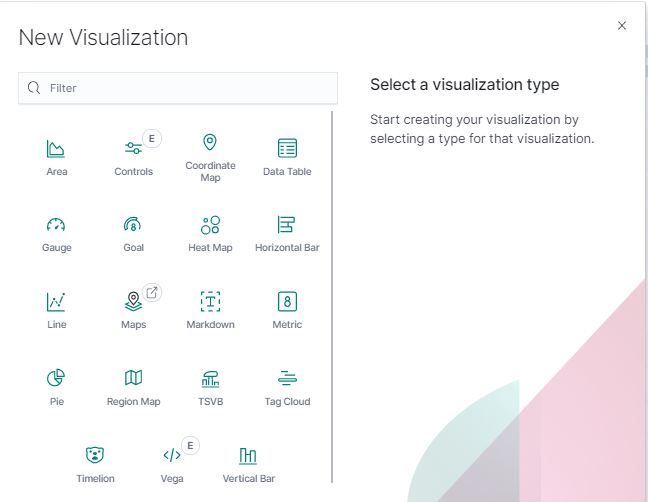
Hover over the Visualization type for a description of what to expect.
Please read our "Visualize" overview article for further information on what to expect to see and use on the Visualization screen itself.