“Dashboard” is the view where you will customise your dashboards and edit them with new visualisations to suit your requirements.
Highlighted are key features you will want to use. Please see the descriptions below the image for more information on each item.
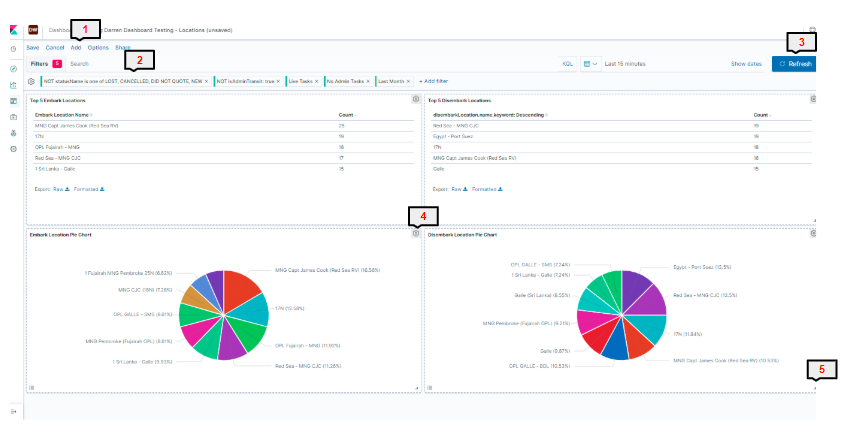
1) Save/Cancel/Add/Options/Share
Save - Save the current dashboard and any changes.
Please note when saving, if you wish to save a new copy of the dashboard after editing and retain the previous version, you must select "Save as New Dashboard" or the existing item will be overwritten.
Cancel - Cancel and discard any changes to a saved dashboard.
Add - Add new items to the dashboard
Options - Edit layout/display
Share - Share a link to the dashboard
Additionally, when you enter an existing dashboard or have saved a dashboard, these menu items will change:
Full Screen - Remove all menu items and see dashboard in full screen
Share - Share a link to the dashboard
Clone - Make a copy of the dashboard
Edit- Start editing the dashboard
2) Filter
Add filters to change the data shown in the visualizations on your dashboard. See our "Filters" article for further information on filters.
3) Refresh
Refresh the data in the visualizations on the dashboard to ensure you are capturing any changes you may have made to your filtered date set
4) Edit on Visualization
Use this to inspect or edit an individual visualization
5) Drag/Reshape
Drag or change the size of a visualization on the dashboard